Dash Apps: Table Viewer
We have released a new public version 1822, as part of our quarterly release schedule. See details at Release Manifests: 1822.
Tutorials will be updated from v1412 in the coming weeks
We have created two webapps to help explore and visualize the data. These apps were created using the Dash framework, hence the name.
Table Viewer
The Table Viewer app allows you to query individual tables in the database, filter them, and visualize the results in Neuroglancer.
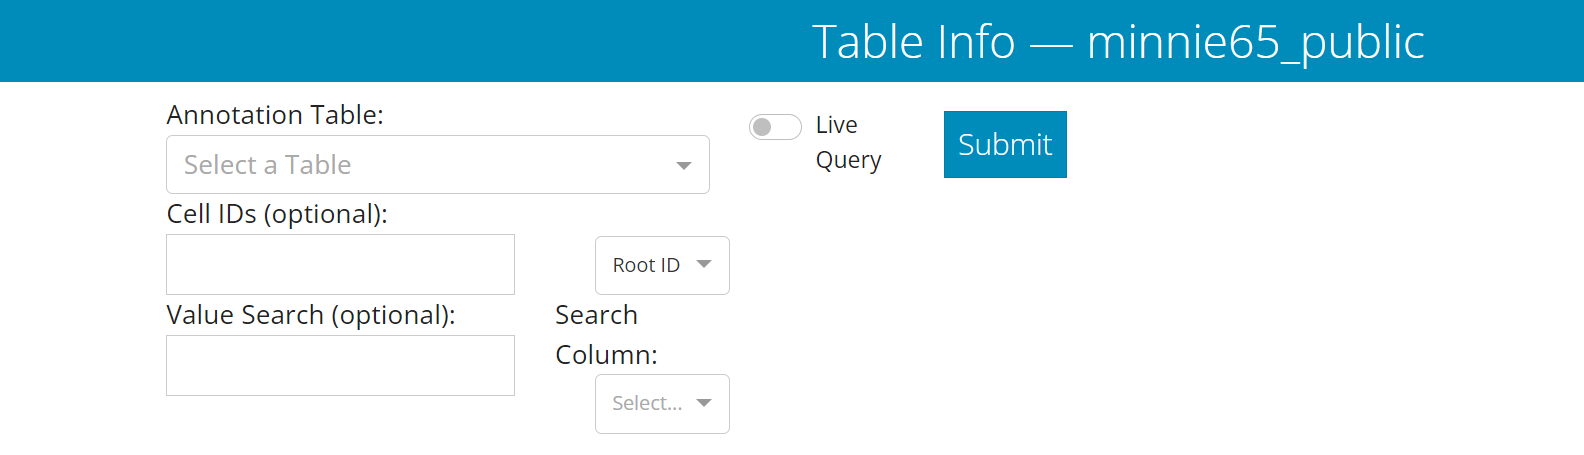
In the Table Viewer, you first select one of the tables from a dropdown in the upper left side.
The Materialization option allows you to select which version of the dataset to query from. Default is ‘latest’.
Filter options allow you to limit the query to a subset of the data, if desired. Note that filtering can occur in the tables afterward as well.
The Cell IDs field lets you put in one or more root IDs, cell IDs (i.e. “Nucleus ID”), or IDs from the annotation table being queried. Note that if you use this option, you havet to set the dropdown to the appropriate ID type.
The Value Search field lets you search the Search Column for a particular value, such as a specific cell type.
Once you have selected your table and set any pre-query filters, click the Submit button to run the query. When the query is done, a green bar will appear below the query input stating that it’s showing the state of the table you queried.
The first set of controls allow you to build a Neuroglancer link for the whole table using the “Generate Link” button.
Optionally, if you would like to make a link where different values of a given column — example, different cell types — are shown in different layers, you can turn on the “Group Annotations” toggle on the right and select the column you want to use for groupings.
You have the drop-down option to select which branch of neuroglancer to use: Seung-lab or Spelunker. If the annotations you expect are not rendering, try the other neuroglancer type.
After setting these controls, click the “Generate Link” button to create the Neuroglancer link.
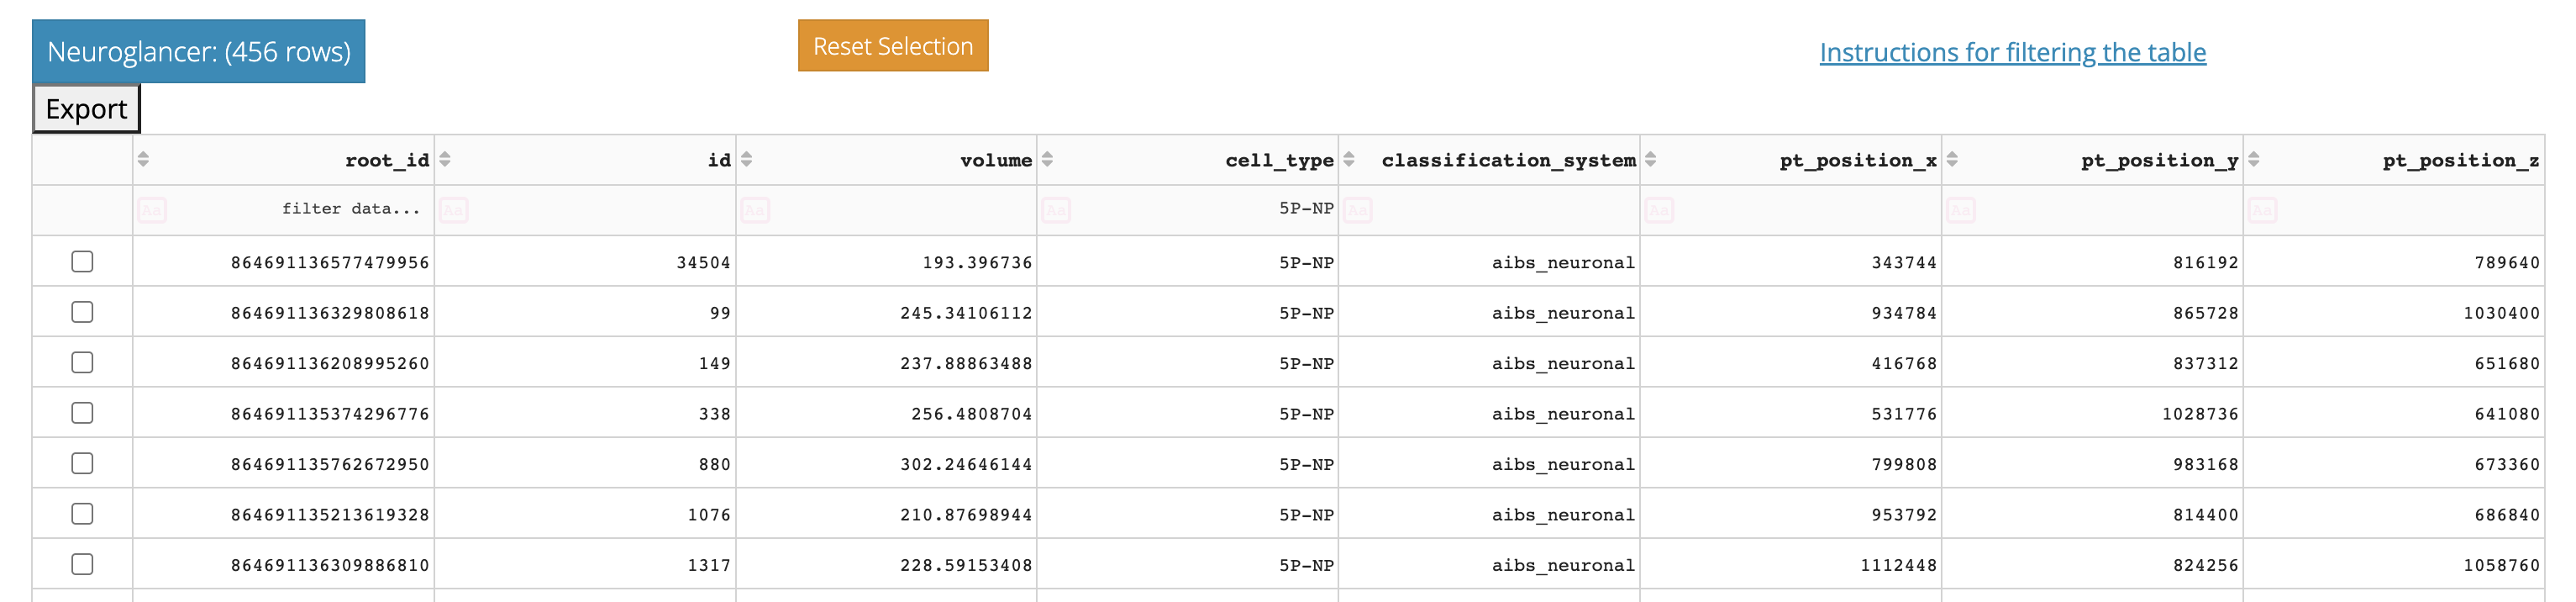
The table itself is shown below the controls. You can sort the table by clicking on the column headers, and filter the table by typing in the filter box below the column headers.
For example, if you want to find only cells with cell type “5P-NP” in a cell type column, simply type 5P-NP in the box under the column header. Similarly, to find only cells whose nucleus volume is greater than 500, type >500 in the box under the volume column header in a table with nucleus information.
In addition, individual rows can be selected by clicking on the checkbox to the left of the row.
The left button along the top is a Neuroglancer link specific to the selected rows, if present, or the table as filtered if no rows are selected.
The orange button will deselect all checkboxes, and the “Export to CSV” will download the table as filtered to a CSV.
If the table is too large (well beyond 10,000 rows), there are too many annotations to show in Neuroglancer and no link will be automatically generated.