Background
A functional connectomics dataset spanning multiple visual areas
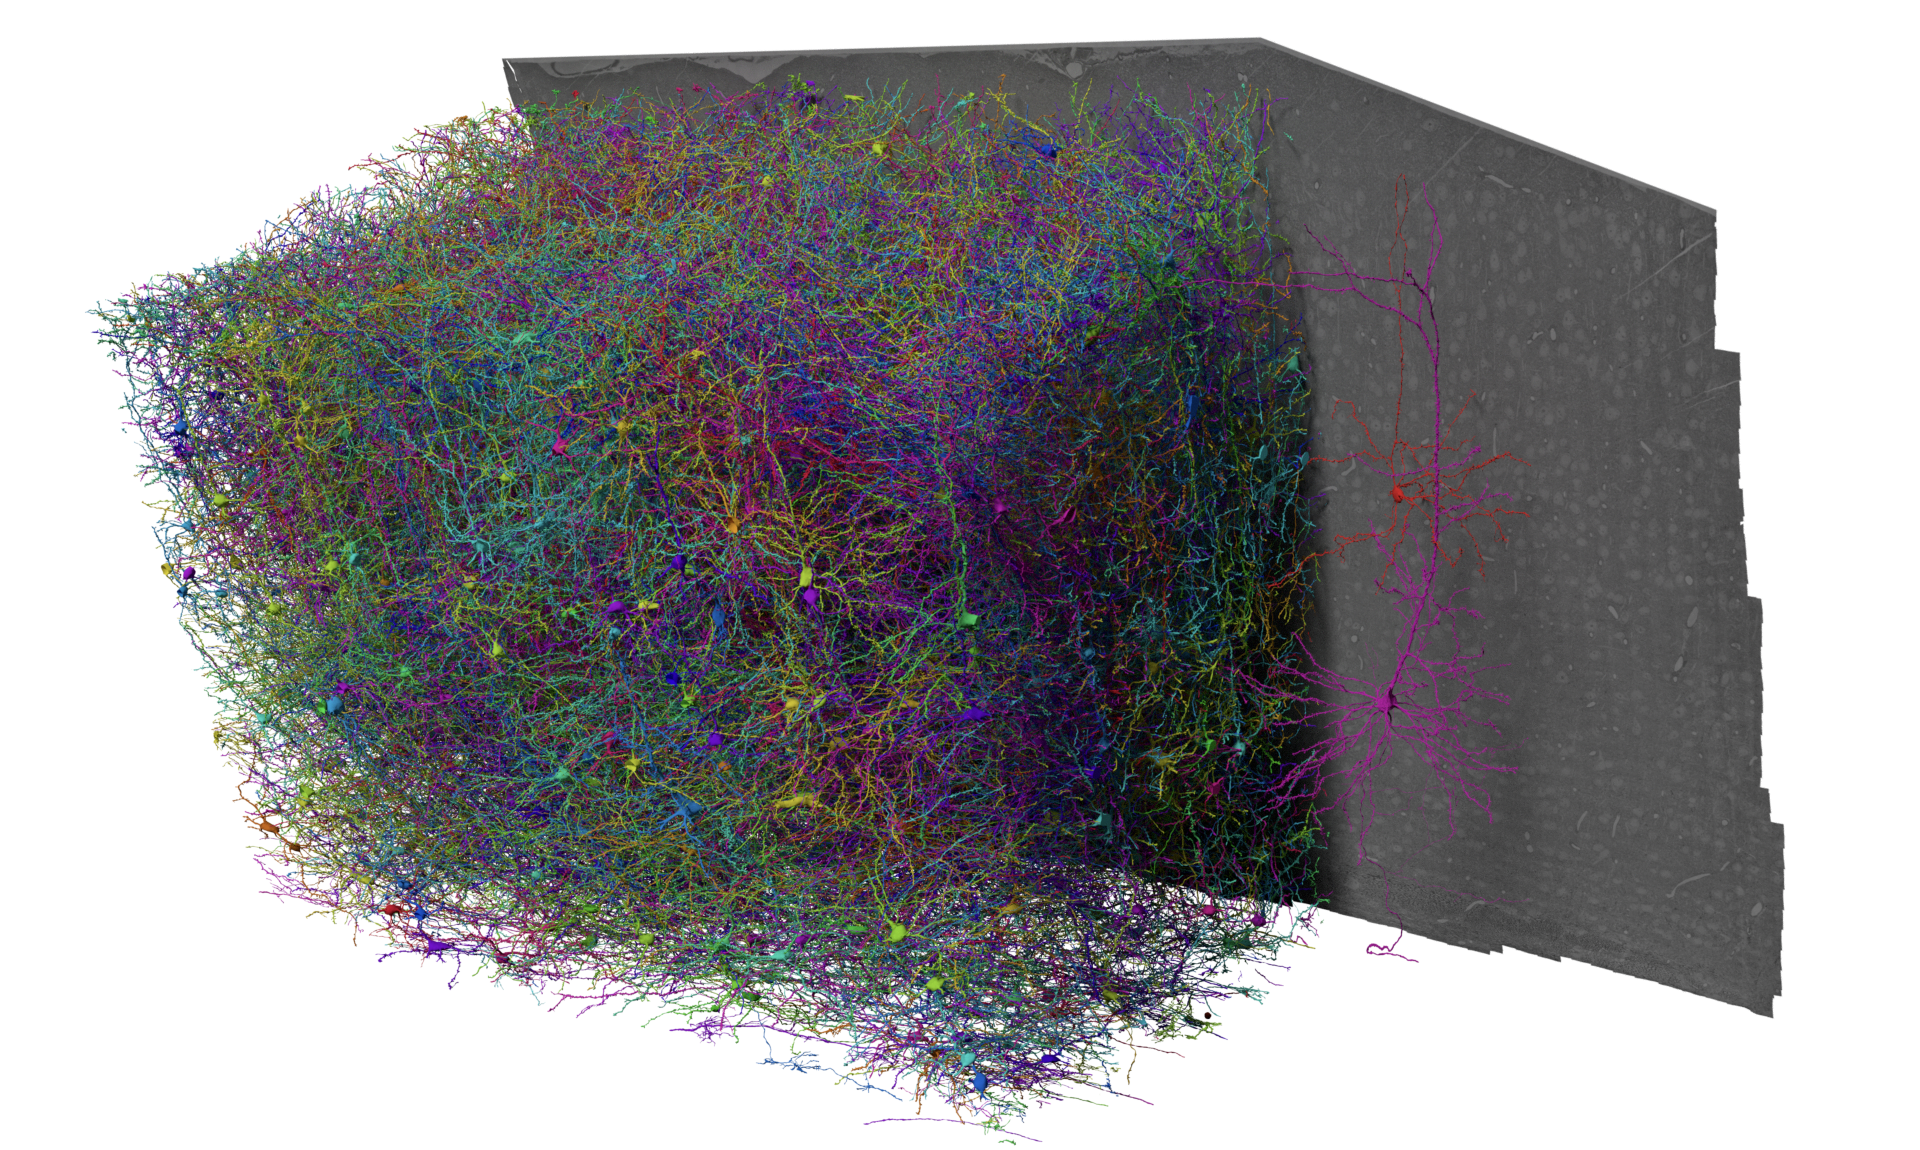
This IARPA MICrONS dataset spans a 1.4mm x .87mm x .84 mm volume of cortex in a P87 mouse. It is 400x larger than the previously released Phase 1 dataset, which can be found here. The dataset was imaged using two-photon microscopy, microCT, and serial electron microscopy, and then reconstructed using a combination of AI and human proofreading.
Functional imaging data of an estimated 75,000 pyramidal neurons in the volume contains the single cell responses to a variety of visual stimuli. That same tissue was imaged with high resolution electron microscopy and processed through a machine learning driven reconstruction pipeline to generate a large scale anatomical connectome. The anatomical data contains more than an estimated 200,000 cells, and 120,000 neurons (details). Automated synapse detection measured more than 523 million synapses.
This makes this dataset remarkable in a few key ways
- It was the largest multi-modal connectomics dataset released and the largest connectomics dataset by minimum dimension, number of cells, and number of connections detected (as of releas in July 2021)
- It is the first EM reconstruction of a mammalian circuit across multiple functional brain areas.
On this set of websites, you can find visualization tools, as well as instructions tutorials for how to query and download portions of the dataset programmatically. To “git started” analyzing data, checkout the MICrONS Programmatic Tutorials for anatomical data and the MICrONS Neural Data Access (NDA) repository for functional data.
The pre-print with details about the dataset is:
MICrONs Consortium et al. Functional connectomics spanning multiple areas of mouse visual cortex. bioRxiv 2021.07.28.454025; doi: https://doi.org/10.1101/2021.07.28.454025
Electron Microscopy methods
The general approach to EM involves staining tissue with heavy metals and using electrons to imaging thin sections of tissue. Sections can either be created by cutting tissue into slices (“serial section”) followed by imaging, or by imaging the face of a block and shaving off a thin layer of tissue after each run (“block face”). In both approaches, each section corresponds to only 30–50 nanometers of thickness (although it can be a millimeter wide), and thus assembling a substantial volumes involves thousands or tens of thousands of sections in a row. Finally, computational methods are used to align and assemble the sections into a single volume and then to segment the volume into individual cells and synapses.
While the resolution afforded by EM has been used to study the nervous system since 1959, the first true “connectomics” project that merged dense mapping of neurons and synaptic connectivity was the study of the nematode C. elegans led by Sydney Brenner, John White, and others. Advances in EM methods and computational methods in the last ten years have allowed tremendous scaling of connectomics datasets. The largest current mammalian datasets, including the MICrONs volume will consider here, now span more than a cubic millimeter, and invertebrate datasets now can cover the entire brain of a fruit fly.
Data Use Cases
Cell Types
![]()
You can use this dataset to explore the morphology and connectivity of a very diverse variety of excitatory, inhibitory, and non-neuronal cell types throughout the volume.
Click these links for example cells: bipolar cells, basket cells, a chandelier cell, martinotti cells, a layer 5 thick tufted, a layer 5 NP cell, layer 4 cells, layer 2/3 cells, blood vessels, astrocytes, microglia. For programmatic access of more systematic cell type information released thus far, explore MICrONS Tutorials.
Synaptic Connectivity
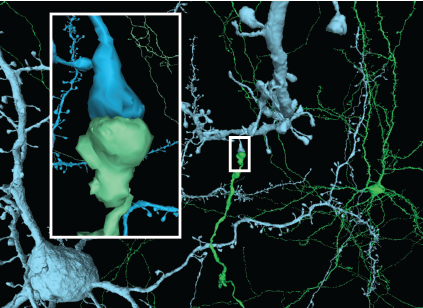
Query from hundreds of millions of synapses in the volume from any of the segmented cells. To see an example visualization with one cell’s inputs and outputs annotated click the button below. We are releasing an app that you can use to query this data non-programmatically and generate a synaptic visualization for any cell. To learn how to query the data programmatically yourself, look at this notebook on MICrONS Tutorials.
Synaptic Visualization (neuroglancer)
Launch Connectivity Viewer (web app)
Functional Data
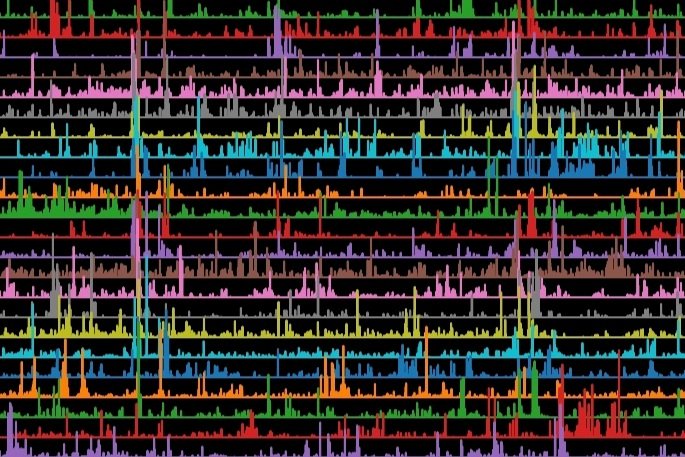
All the functional recordings from 115,372 regions of interest and 75,902 estimated neurons are available, including the response of those units to a variety of visual stimuli. You can download the database of functional recordings to explore how cells responded to visual stimuli. For a subset of the neurons, we have generated a correspondence between their functional recording and their anatomical reconstruction.
To learn how to query the functional databases and link them to the anatomical data, you can view this notebook on MICrONS NDA, or access a hosted database and interactive notebooks by following the instructions at this repository.